Machine Learning 실습예제 - k-means clustering
Modeling 구성
K-Means Clustering
We will use the following imports for this problem
import os
import numpy as np
import pandas as pd
Part B
Implement a Python function called cost that takes in a cluster and a centroid, and returns the cost of the cluster associated with that centroid. Assume that each point is given as a list of coordinates, and each cluster is given as a list of points. The five data points you worked with in part (a) are given in this format below.
Hint: Recall that $cost(\mu_j)$ is the total squared distance of each $\overrightarrow{x_i}$ in $C_j$ to $\mu_j$. Start by defining the helper function squared_distance.
def squared_distance(x, u):
    """Function to calculate the square of the Euclidian distance between a data point x and its centroid u"""
    return (x[0] - u[0]) ** 2 + (x[1] - u[1]) ** 2
def cost(C, u):
    """Function to calulate the cost of a cluster and its centroid"""
    cost = 0
    for i in C:
        distance = squared_distance(i, u)
        cost = cost + distance
    return cost
x1=[3,10]
x2=[5,76]
x3=[1,8]
x4=[2,9]
x5=[3,78]

C1= [x1, x3, x4]
C2= [x2, x5]
Now, calculate the total cost before the first iteration and after the first iteration of the algorithm, with these five data points. Recall that the total cost $cost(\mu_1, \dots, \mu_k)$ is defined as \(cost(\mu_1, \dots, \mu_k) = cost(\mu_1)+\dots+ cost(\mu_k).\) You should find that the cost has decreased after the first iteration.
before_cost = cost(C1, x1) + cost(C2, x2)
after_cost = cost(C1, [2, 9]) + cost(C2, [4, 77])

print("The total cost before the first iteration is", before_cost)
print("The total cost after the first iteration is", after_cost)
The total cost before the first iteration is 18
The total cost after the first iteration is 8
Part C
Using the data points in k_means_data.csv, follow the prompts below to implement the k-means clustering algorithm with $k=3$ clusters.
We’ll start by reading in the data.
fp = os.path.join("k_means_data.csv")
table = pd.read_csv(fp) #Import the data
data = table.values.tolist() #Put the data in a form that is easier to use
First, write a function to initialize the centroids by choosing $k$ random data points. We’ll use initialize_centroids with $k=3$ since we want to find three clusters.
def initialize_centroids(data, k):
    """Return k randomly selected centroids from among the data points"""
    random_numbers = np.random.choice(len(data), 3, replace = False)
    return [data[random_numbers[0]], data[random_numbers[1]], data[random_numbers[2]]]
centroids = initialize_centroids(data, 3)
centroids
[[2.4257491105903943, 7.9548128907273234],
 [6.705188928008579, 78.00202552760933],
 [3.9966062985857884, 77.1128640020023]]
Next, implement a function that determines the closest centroid for a given data point. The function find_closest_centroid should take as input a single data point as well as a list of centroids. It should return the centroid that’s closest to the given data point.
Hint: You can use the squared_distance function you’ve implemented above.
def find_closest_centroid(point, centroids):
    """Function to determine the closest centroid to a given data point"""
    lst = []
    for i in centroids:
        distance = squared_distance(point, i)
        lst.append(distance)
    minimum = min(lst)
    index = lst.index(minimum)
    return centroids[index]
The function below puts each data point into a group (cluster), based on which of the centroids it is closest to. The groups are labeled 1 through $k$, where group 1 contains the points that are closest to the first centroid in the centroids list.
def define_groups(data, centroids):
    groups = []
    for point in data:
        closest = find_closest_centroid(point, centroids)
        groups.append(centroids.index(closest)+1)
    return groups
group_list = define_groups(data, centroids)
Now, we need to relocate the centroids to the average of all points in that group. The function to do that is provided below. You should read through it and make sure you understand how it works.
def update_centroids(data, k, group_list):
    """Function that takes in data, k, and a list of groups and returns a list of new centroids"""
    new_centroids=[]
    for i in np.arange(k)+1:               #for each cluster
        total = np.array([0.0,0.0])
        count = 0
        for j in range(len(data)):          #go through each data point
            if group_list[j]==i:                   #if the data point is in this cluster
                total+=np.array(data[j])                          #add the data point to this cluster's total
                count+=1                                          #and increment the count of points in this cluster
        new_centroid = total/count
        new_centroids.append(list(new_centroid))
    return new_centroids
new_centroids = update_centroids(data, 3, group_list)
new_centroids
[[-1.1198909887743935, 14.547028738295456],
 [6.097314819873166, 78.12828163677702],
 [4.4561307948150395, 77.47263629489235]]
Finally, put together the functions above to run the k-means algorithm to find the centroids that yield the least cost. To make it a little easier, just update the centroids a fixed number of times, $1000$ times. You can think about how you would implement a better stopping condition.
Complete the k_means function below. The inputs are the data, the value of $k$, and the initial centroids. The function should return a list of the centroids after $1000$ updates.
def k_means(data, k, initial_centroids):
    """Implement the k-means algorithm given data points, number of clusters, and initial centroids as input.
    Return a list of centroids with least cost."""
    group_list = define_groups(data, initial_centroids)
    for i in range(1000):
        updated_centriods = update_centroids(data, k, group_list)
        group_list = define_groups(data, updated_centriods)
    return updated_centriods
k_means(data, 3, initialize_centroids(data, 3))
[[1.9920820677628333, 9.118216804679005],
 [5.028058561123173, 77.7011187625188],
 [-4.231864045311622, 19.9758406719119]]
For this part, turn in screenshots of the three functions you wrote:
initialize_centroidsfind_closest_centroidk_means
as well as the output of your k_means function.
x_values = []
y_values = []
for i in data:
    x_values.append(i[0])
    y_values.append(i[1])
data_df = {
    'X': x_values,
    'Y': y_values
}
import pandas as pd
import matplotlib.pyplot as plt
df = pd.DataFrame(data_df, columns = ['X', 'Y'])
df
| X | Y | |
|---|---|---|
| 0 | 0.671723 | 11.737969 |
| 1 | -3.757326 | 18.536079 |
| 2 | 5.275413 | 78.514845 |
| 3 | 4.006203 | 77.254795 |
| 4 | -5.764720 | 20.356741 |
| ... | ... | ... |
| 193 | 4.050378 | 77.779269 |
| 194 | -3.449263 | 18.837490 |
| 195 | 3.740859 | 76.031105 |
| 196 | -5.839885 | 17.661508 |
| 197 | 1.513687 | 10.920654 |
198 rows × 2 columns
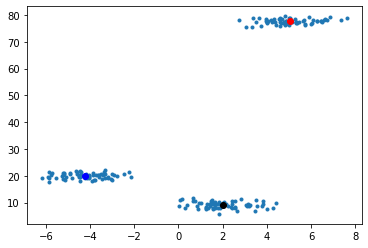
centroids_1000 = k_means(data, 3, initialize_centroids(data, 3))
centroids_1000
[[-4.231864045311622, 19.9758406719119],
 [5.028058561123173, 77.7011187625188],
 [1.9920820677628333, 9.118216804679005]]
plt.plot(df['X'], df['Y'], '.')
plt.plot(centroids_1000[0][0], centroids_1000[0][1], 'bo')
plt.plot(centroids_1000[1][0], centroids_1000[1][1], 'ro')
plt.plot(centroids_1000[2][0], centroids_1000[2][1], 'ko')
[<matplotlib.lines.Line2D at 0x190a2d63e80>]